Product:
Planning Analytics 2.0.9.19
Microsoft Windows 2019 server
Google Chrome
Issue:
The background image in TM1WEB is changed on the server – but the change is not shown on end users web browsers.
Solution:
On many browsers, pressing Control-F5 will reload the page and bypass the cache. The Wikipedia “Bypass your cache” page has details for all modern web browsers.
Or you can change the name of the file PA_header.svg in folder D:\Program Files\ibm\cognos\tm1web\webapps\tm1web\scripts\tm1web\themes\carbon\standalone\images\login to something else. Then you need to update all code that calls that file – can be this css-html files for tm1web:
D:\Program Files\ibm\cognos\tm1web\webapps\tm1web\scripts\tm1web\themes\carbon\carbon.css
D:\Program Files\ibm\cognos\tm1web\webapps\tm1web\scripts\tm1web\themes\carbon\standalone\all.css
D:\Program Files\ibm\cognos\tm1web\webapps\tm1web\scripts\tm1web\themes\carbon\standalone\LoginDialog.css
Or clean the Web Browser cache at the end users laptop.
More Information:
https://www.avast.com/c-how-to-clear-cache
Resurrecting images from a web browser cache can be a useful way to recover lost or deleted images that you previously viewed online. Here’s a step-by-step guide on how to do this for various web browsers:
Google Chrome
- Access Cache:
– Typechrome://cachein the address bar and press Enter. This will take you to a list of cached files. - Find Images:
– You can’t view the images directly, but you can see the URLs. To find images, you can also use a tool like ChromeCacheView (a third-party utility) that allows you to view and extract images from the cache more easily. - Extract Images:
– If using ChromeCacheView, download and run it. It will display cached files, including images. You can select the images you want to save and extract them to your computer.
Mozilla Firefox
- Access Cache:
– Typeabout:cachein the address bar and press Enter. This will show you the disk and memory cache information. - Find Images:
– Look for the section that lists the cache entries. You can find images by checking the file type and URL. - Extract Images:
– You can use Mozilla’s cache viewer or a third-party tool like Firefox Cache Viewer to extract images more conveniently.
Microsoft Edge
- Access Cache:
– Typeedge://cachein the address bar and press Enter. This will show you cached items. - Find Images:
– Similar to Chrome, you might need a third-party tool like EdgeCacheView to find and extract images.
Safari
- Access Cache:
– For Safari, the cache is not easily accessible like in other browsers. You can use Terminal commands or third-party tools. - Find Images:
– You can also look in the~/Library/Caches/com.apple.Safari/directory to find cached files. - Extract Images:
– Use a third-party application like SafariCache to help retrieve images from the cache.
General Tips
- Look for File Types: When browsing the cache, look specifically for file types like
.jpg,.png, or.gif. - Use Third-Party Tools: Tools like WebCacheImage, ChromeCacheView, and others can simplify the process.
- Browser Extensions: Some extensions can help manage and view cached files directly from the browser.
https://www.linkedin.com/pulse/11-ways-fix-google-chrome-loading-images-benjamin-ladegbaye
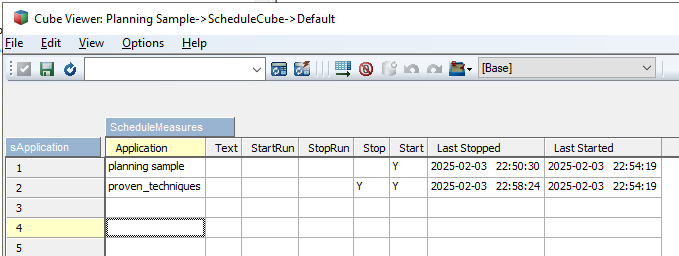
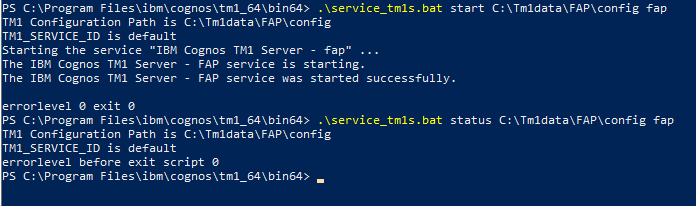 Here we start TM1 instance FAP, in folder c:\tm1data\FAP\config.