Product:
Microsoft Windows Server
Issue:
How configure the agent-config.yaml file to work?
Solution:
The new windows agent for Grafana Cloud should make it easy to collect some metrics from your computers to the dashboard in the cloud.
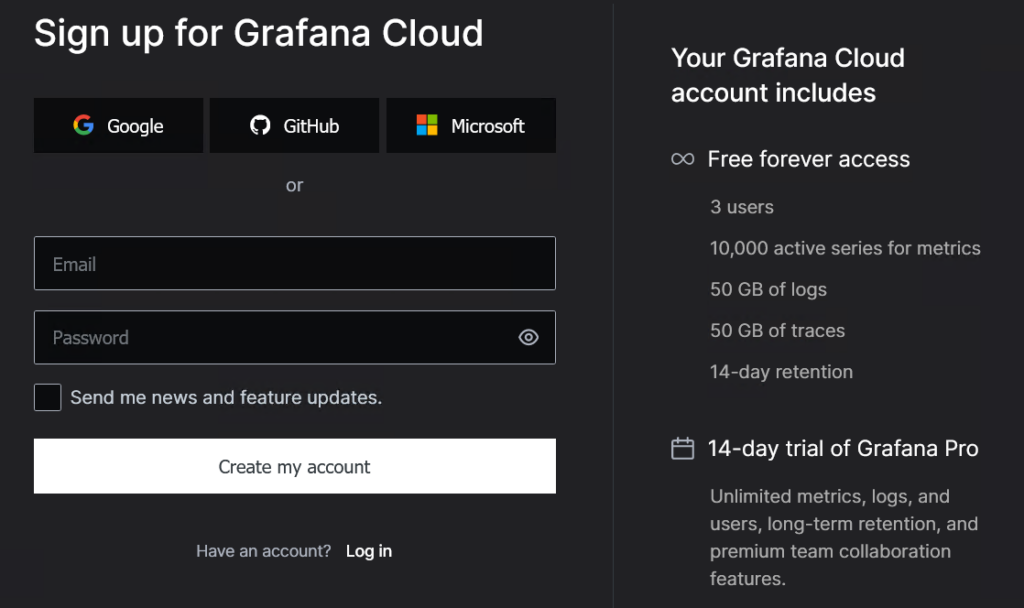
Sign up for a account at https://grafana.com/auth/sign-up/create-user?pg=dl&plcmt=box-right
Download the agent and install the agent from here https://grafana.com/blog/2021/04/22/weve-added-first-class-windows-support-to-grafana-agent/
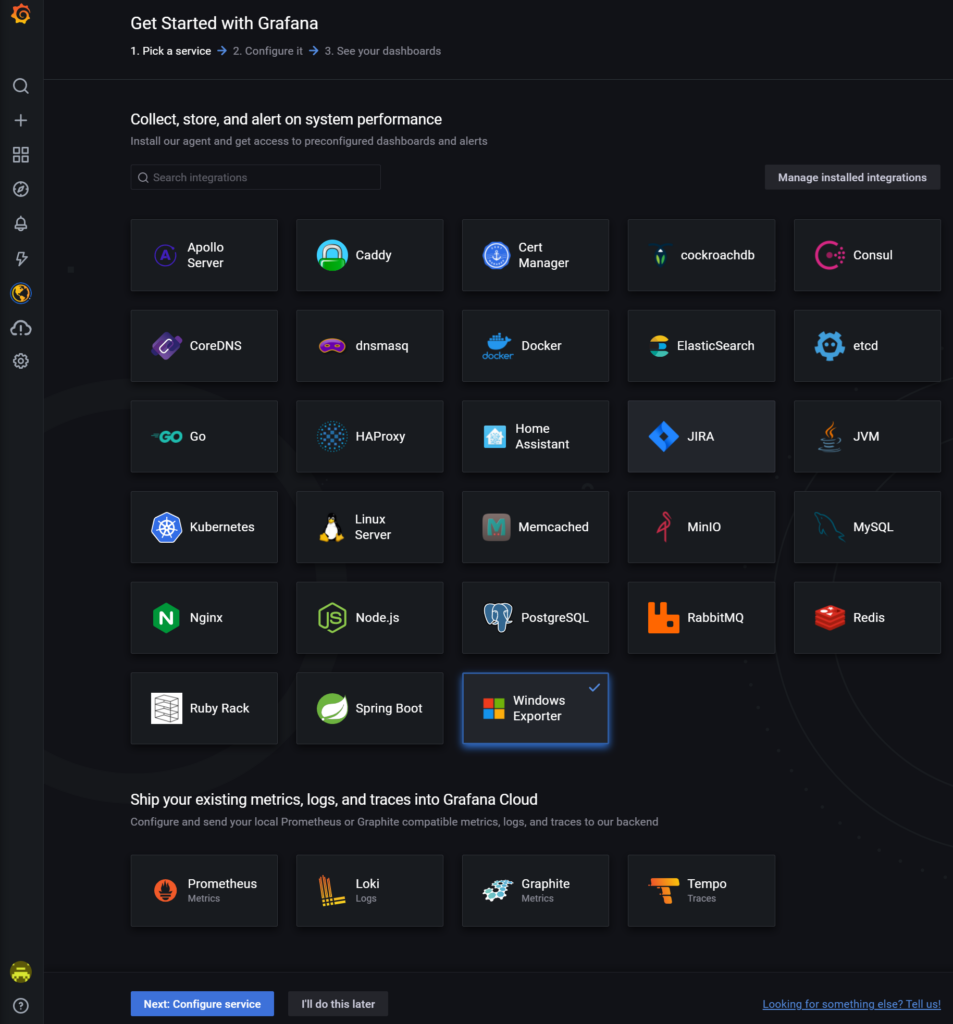
If you click “Get Started with Grafana”, from your grafana.net page, you will see a list of local agent you can install to collect metrics (data) from your system. Click on Windows exporter and Next.
After you have configure the windows agent, as below, you can go back to this page and click “Test integration and finish installation”.
There is a default agent-config.yaml file created, where you need to add your url and username to make the agent ship data to the grafana cloud.
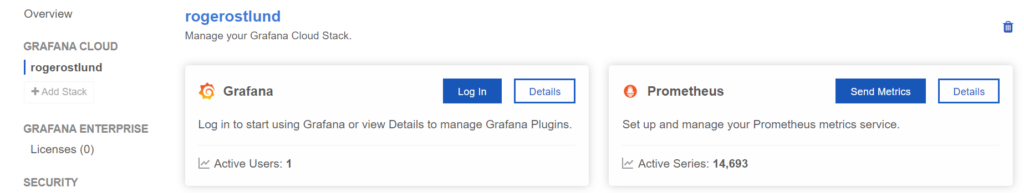
You get your Password (API key) on your host page – go to your name under grafana cloud, and then click on prometheus details to get the key and urls. Click on grafana details to go to your cloud dashboard.
You need to copy the following values, and place in your yaml file.
Remote Write Endpoint (Use this URL to send Prometheus metrics to Grafana Cloud.)
Username / Instance ID (Your Grafana Cloud Prometheus username.)
Password / API Key (Your Grafana Cloud API Key. Be sure to grant the key a role with metrics push privileges.)
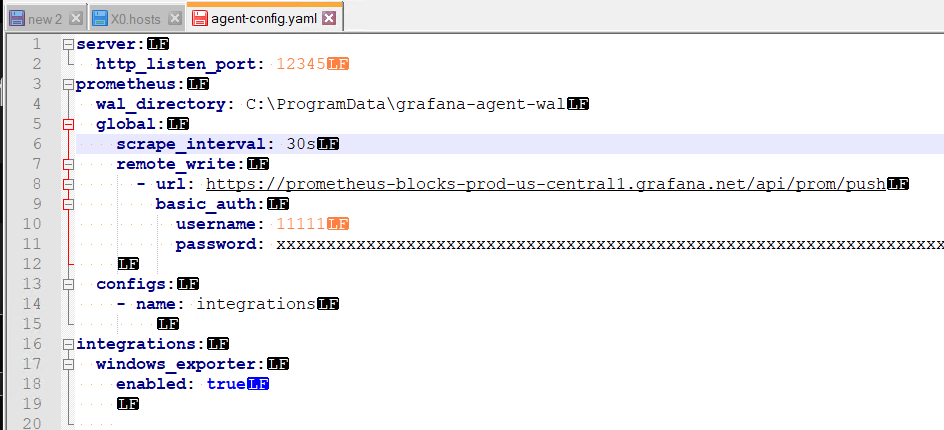
Open C:\Program Files\Grafana Agent\agent-config.yaml in notepad++ on your computer.
You need to add the lines remote_write (very important that every line is indent with two spaces)
remote_write:
  - url: https://prometheus-blocks-prod-us-central1.grafana.net/api/prom/push
    basic_auth:
      username: (the user number from your account)
      password: (the long password from your account)
In YAML file is important to indent the text correct, and the order of the lines, have a meaning. Above setup worked for me, to send data to the grafana cloud. You may find other configurations, also work well.
Then go to your grafana.net page, and select “integration – Windows Exporter” dashboard.
Monitoring Windows Services with Grafana, InfluxDB and Telegraf
You will soon fill up your free account, so you must limit the services that is reported up to the cloud.
Add last to your agent-config.yaml file this lines, to limit the information collected:
 # List of collectors to enable
 enabled_collectors: "cpu,system,os,cs,time"
You can copy your text to a YAML checker: https://codebeautify.org/yaml-validator
Here is some information of possible values in the file:
| cpu | CPU usage | ✓ |
| cpu_info | CPU Information | |
| cs | “Computer System” metrics (system properties, num cpus/total memory) |
| net | Network interface I/O | ✓ |
| os | OS metrics (memory, processes, users) | ✓ |
| process | Per-process metrics | |
| remote_fx | RemoteFX protocol (RDP) metrics | |
| service | Service state metrics | ✓ |
| smtp | IIS SMTP Server | |
| system | System calls |
https://github.com/prometheus-community/windows_exporter/blob/master/README.md
https://grafana.com/grafana/dashboards/6593
More Information:
https://github.com/prometheus-community/windows_exporter
For a full description of configuration options, see windows_exporter_config in the Grafana Agent documentation.
After installation, the Agent config is stored in C:\Program Files\Grafana Agent\agent-config.yaml. Anytime the config file is modified, run the following to restart the Windows Agent so it can pick up changes:
sc stop "Grafana Agent"
sc start "Grafana Agent"
https://devconnected.com/how-to-setup-grafana-and-prometheus-on-linux/
https://prometheus.io/download/
https://githubmemory.com/repo/prometheus-community/windows_exporter/issues/757
https://grafana.com/docs/grafana-cloud/how-do-i/control-prometheus-metrics-usage/usage-reduction/