Product:
Planning Analytics version 2.0.9.19 (PAL)
Microsoft Windows 2019 Server
Issue:
How upgrade to Planning Analytics Workspace 100 from version 96 on Microsoft Windows 2019 server?
Solution:
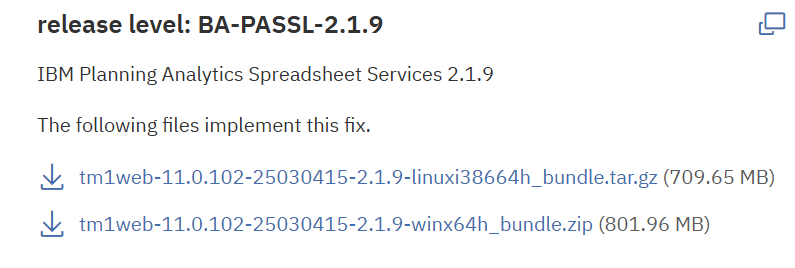
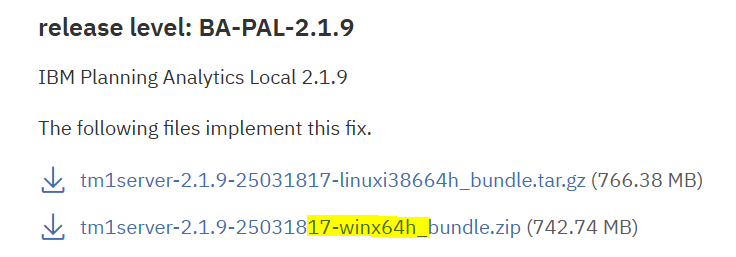
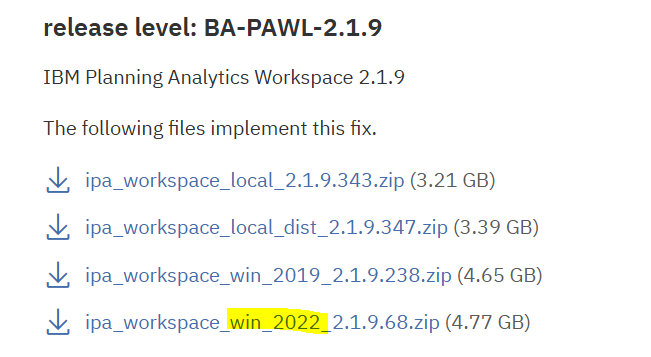
Download the correct file from IBM Fix Pack. https://www.ibm.com/support/pages/download-ibm-planning-analytics-local-v20-planning-analytics-workspace-release-100-fix-central
ipa_workspace_win_2019_2.0.100.219.zip
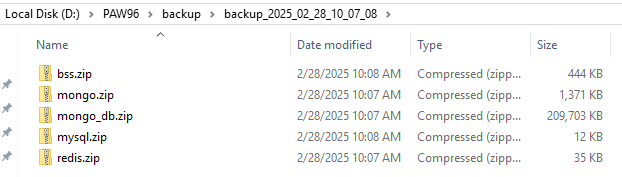
Copy the zip file to your Windows server where you run PAW. Unzip the file to a folder named d:\running\paw100, should look like below (after the installation)

Ensure that the Windows server have 25 GB ram (the new version of PAW demands more memory).
Ensure you have at least 100 GB free disk space on the server, (the installation takes around 12 GB for the new version).
This version use a new Mongo database, before you upgrade you need to backup your content in the existing solution.
Update the anti-virus software on the Windows server to not scan above newly created folder and subfolders.
Start powershell as administrator, and go to the old PAW installation folder.
Run backup.ps1 from the scripts folder.

This will restart the PAW and create backup in a folder with todays date, as below:
Now you in the \paw96\scripts folder enter paw.ps1 stop, to stop the old version from running.
Enter docker ps, to check that there is no containers running, before you start the installation.
Copy the d:/paw96/config/paw.ps1 file from your current installation to the new installation location e.g. d:\running\paw100\config\.
Copy the d:/paw96/config/certs directory from your current installation to the new installation location.
If you have configured SSL, copy the <paw_install_location>/config/ssl directory from your current installation to the new installation location.
Inside the powershell window, go to the new folder d:\running\paw100 and enter start.ps1
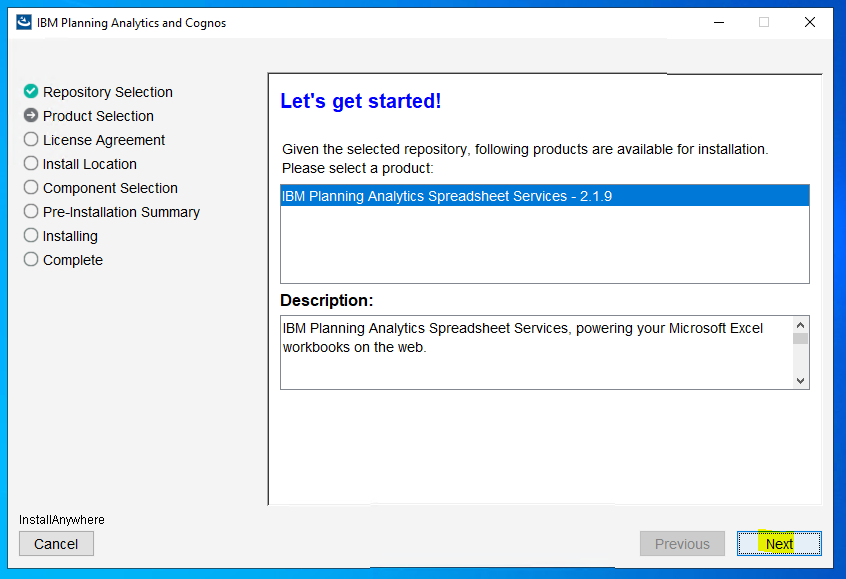
After the check have passed, enter y to start the installation.
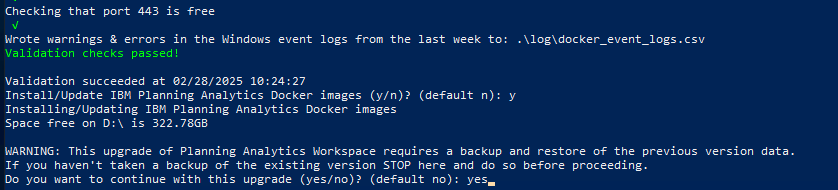
Enter yes, to get the installation to continue, after you confirmed that you have made a backup.
Enter y to start the Administrative console. If you have chrome on the server, it will start up and you have to accept the license requirements for all 3 parties components.
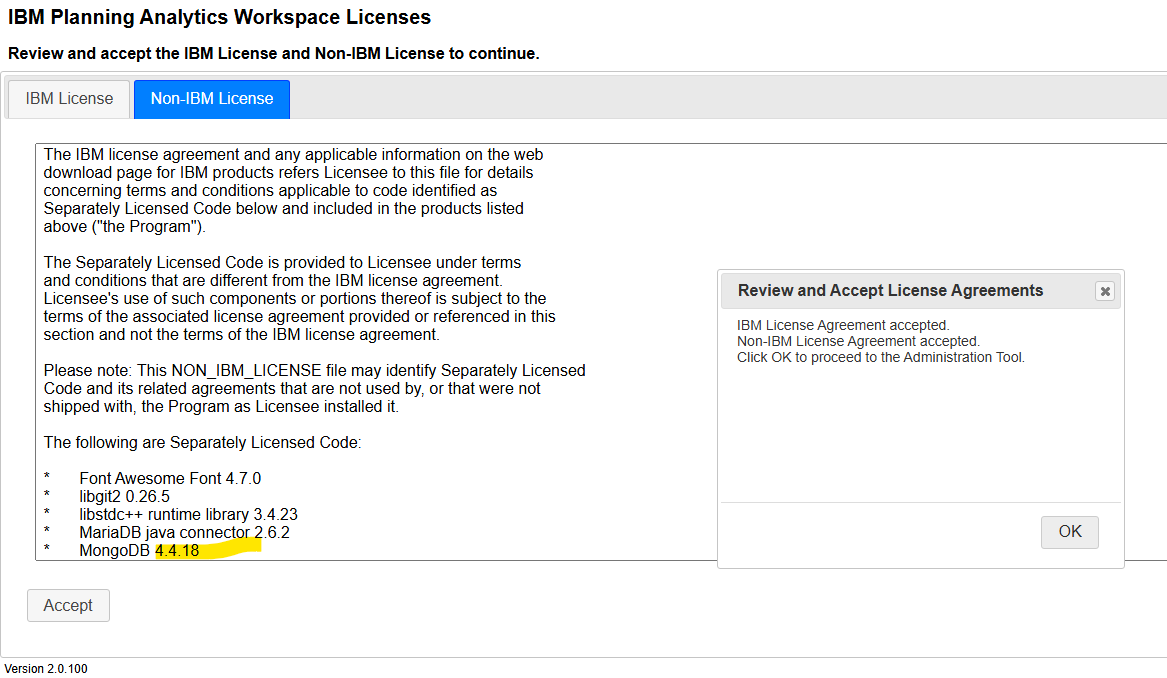
You can see the version number above, to ensure you are installing version 100.
When you get to the configuration page, click validate, to ensure that all ports are still open. The config URL should be the same as they are read from the paw file you copied before.
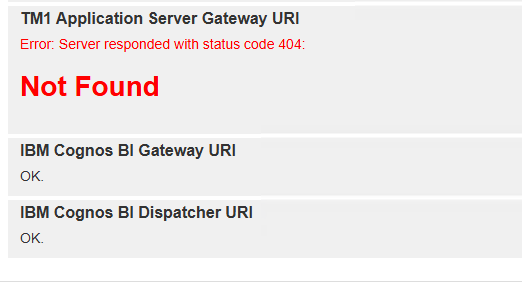
TM1 application server gateway URI is not used anymore, so this error is OK. Click on update, to restart the PAW containers.
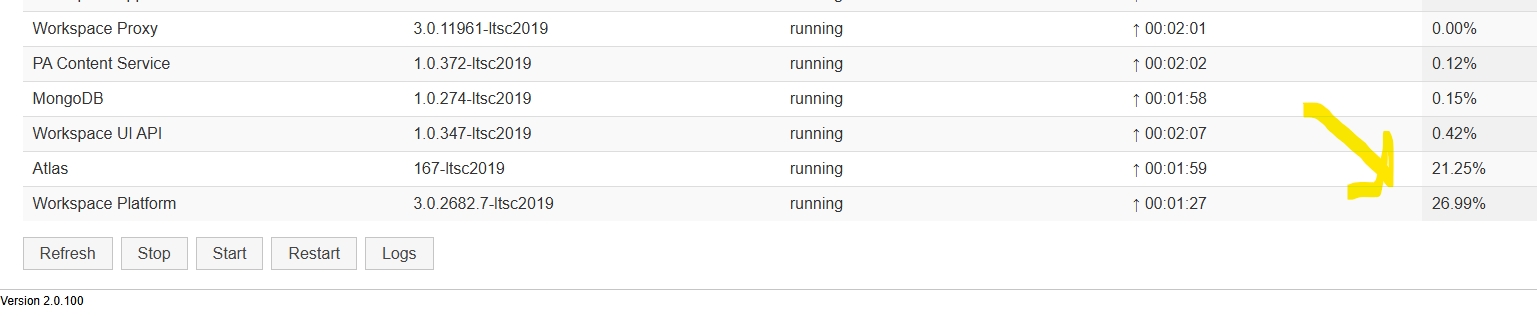
On the status page, can you see what process take the most CPU at the moment. The start of PAW take time, you have to wait.
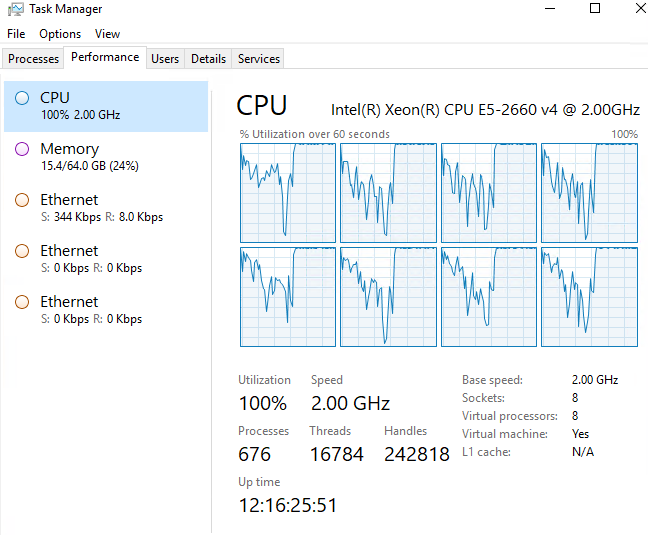
If you get a lot of errors, you may need faster CPU and more MEMORY on the server.
When the server settles, and you have check that you can browse to your planning analytics workspace from you chrome web browser, it is time to restore the databases.
Inside Powershell window on server, copy the path to you backup folder, and then go to the new script folder at d:\running\paw100\scripts and enter restore.ps1 “path to you backup folder” as picture show below:
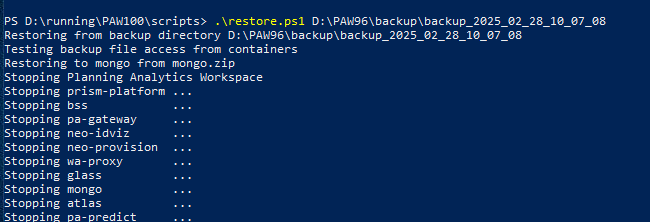
This will stop PAW and restore the database, so you have all your books and reports back into PAW.
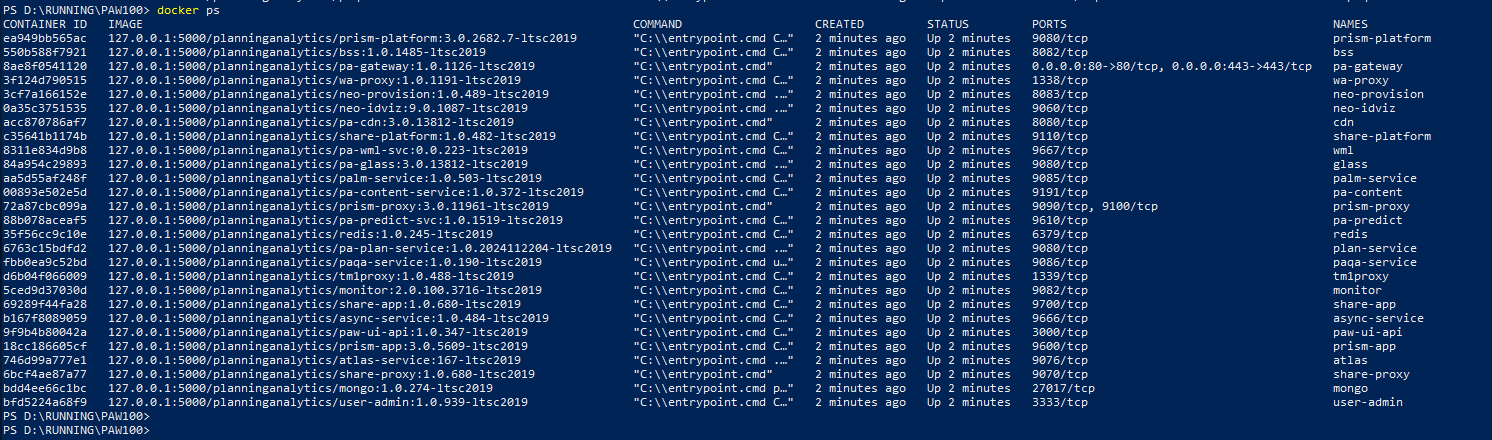
When all is running, you should have this containers on your PAW server:
Now you need to go to your administrator page in PAW, and click on agent, to come to the page where you can download the new PAA agent file to install on your TM1 servers.
Download the file paa-agent-pkg-2.0.100.1800.zip
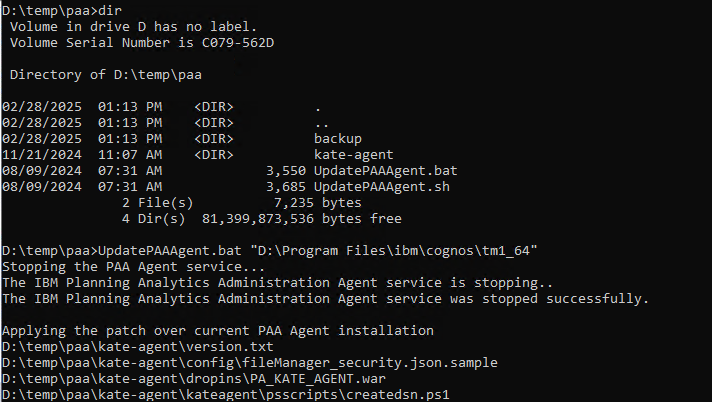
Copy the file to the TM1 server, and unzip it to a folder like d:\temp\paa
Check the path to your existing PAA agent – D:\Program Files\ibm\cognos\tm1_64\paa_agent..
Make a backup of file D:\Program Files\ibm\cognos\tm1_64\paa_agent\wlp\usr\servers\kate-agent\bootstrap.properties
Start a command prompt as administrator, and go to the folder where you have unzip the paa agent files. Enter updatepaaagent.bat “d:\program files\ibm\cognos\tm1_64”
When it is done, start your web browser on your laptop and go to the PAW site, and go to administration, agent, to test the mail function, click on Test email.
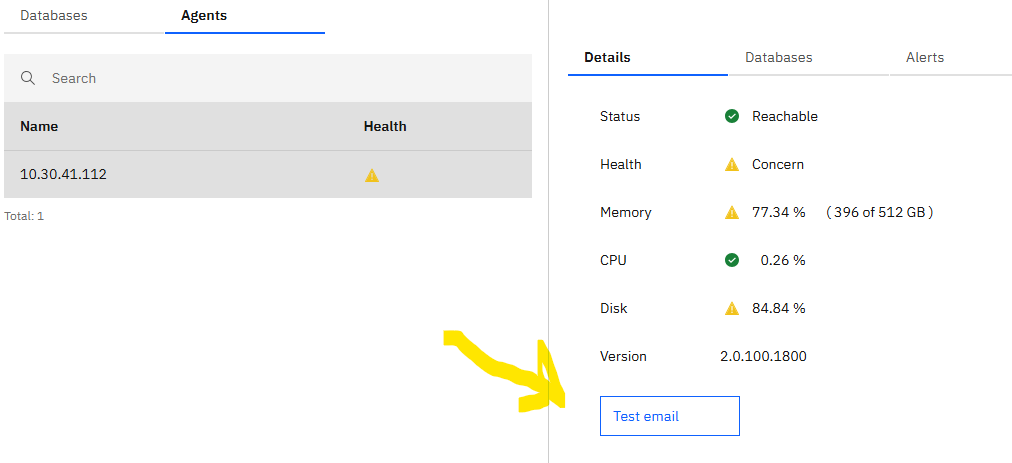 Email will only work if you have it configured.
Check that you have your folders and books back in PAW. If all works, then the upgrade was a success.
https://www.ibm.com/docs/en/planning-analytics/2.0.0?topic=2wnj12-enable-email-notifications-in-planning-analytics-workspace-local-1
More Information:
https://exploringtm1.com/planning-analytics-workspace-scripts/
https://www.ibm.com/docs/en/planning-analytics/2.0.0?topic=local-upgrade-planning-analytics-workspace
https://www.ibm.com/docs/en/planning-analytics/2.0.0?topic=ipawl-install-planning-analytics-workspace-local-windows-server-2019-2022
https://www.ibm.com/support/pages/important-upgrade-requirement-planning-analytics-workspace-local-20100-and-217
https://www.ibm.com/docs/en/planning-analytics/2.0.0?topic=local-backup-restore-planning-analytics-workspace
https://www.ibm.com/support/pages/after-each-reboot-some-planning-analytics-workspace-containers-are-failing-start
https://www.ibm.com/docs/en/planning-analytics/2.0.0?topic=components-planning-analytics-administration-agent-local-only
https://www.ibm.com/docs/en/planning-analytics/2.0.0?topic=integrations-configure-integration-watsonxai-support-decision-optimization
https://cloud.ibm.com/apidocs/watson-data-api#creating-an-iam-bearer-token
https://cubewise.com/blog/ibm-planning-analytics-workspace-paw-2-0-100-2-1-7/


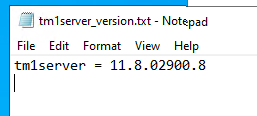 The version of the installed TM1 program is now in other txt files than before.
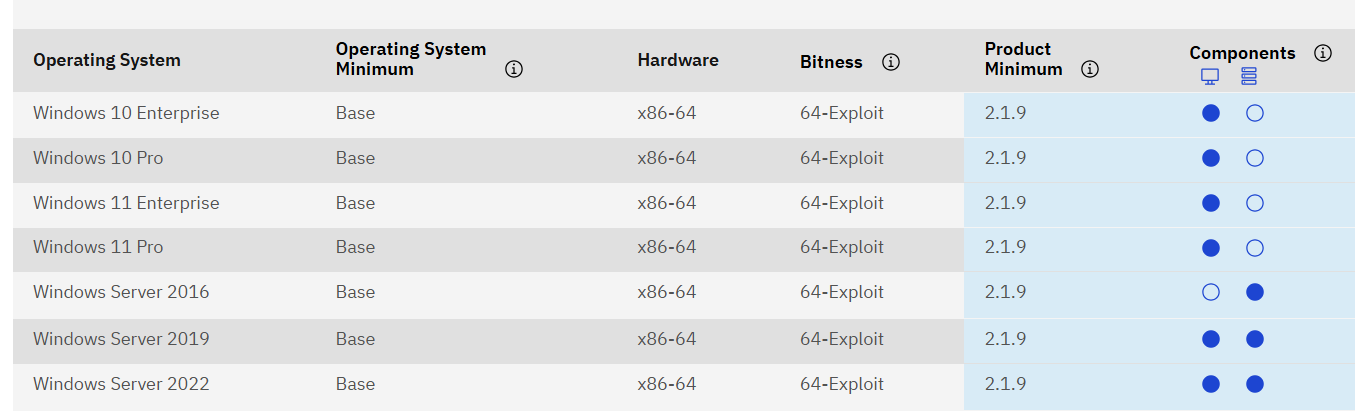

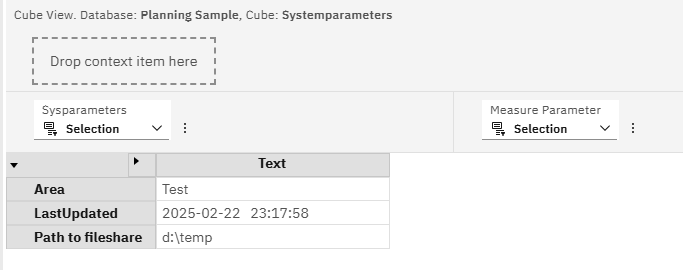
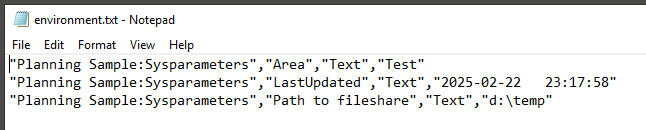
 The file will look like below;