Product:
Cognos Analytics 11 CP4D
Linux
Problem:
How report on a DB2 database?
Suggested Solution:
Depending on what data source you are going to connect to – the way may be different.
https://www.ibm.com/support/producthub/icpdata/docs/content/SSQNUZ_current/cpd/access/data-sources.html
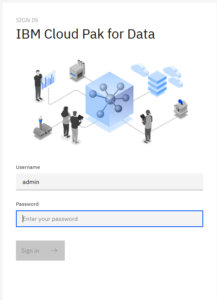
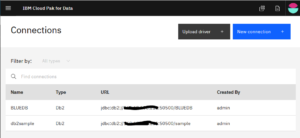
Login to Cloud pak for data to setup the data source (this is only for Cognos Content Store called BLUEDB).
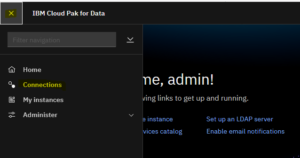
Click on menu icon to get to the connections
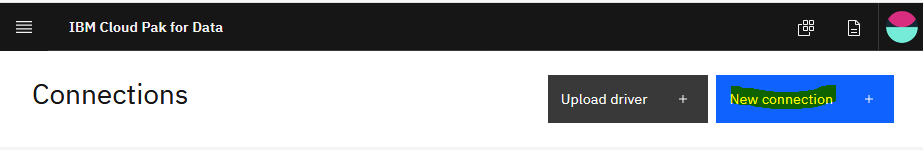
Click on new connection
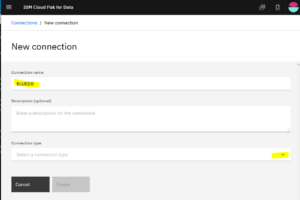
Enter a name for the connection and click on the drop down menu to select type of data source. When you select DB2, you get other fields to complete.
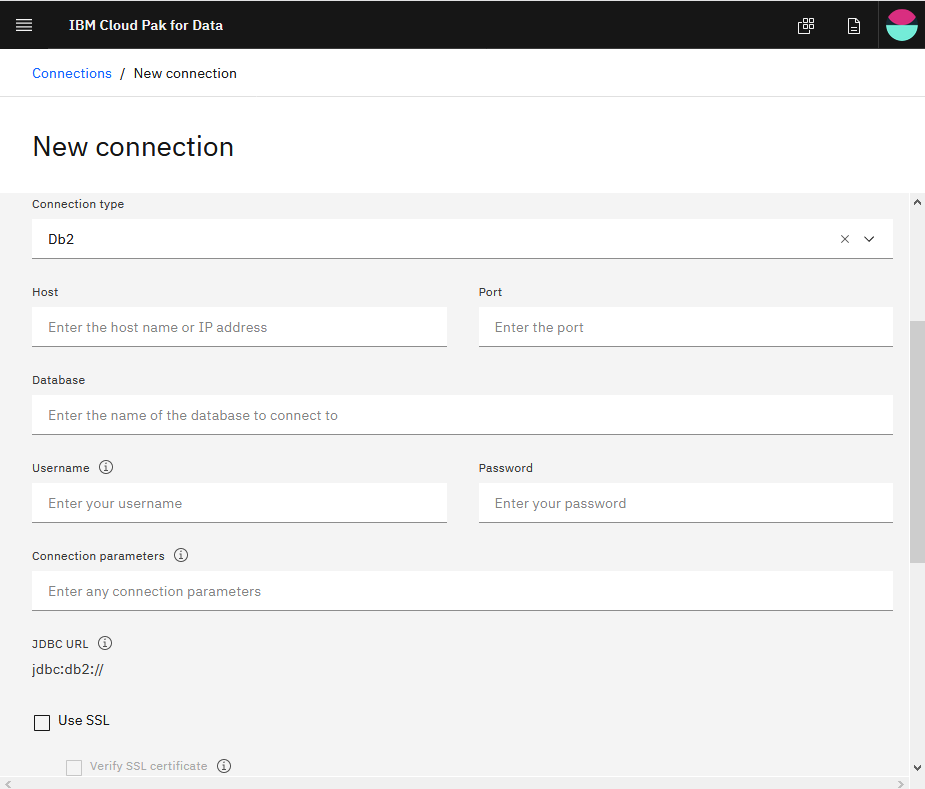
Enter the IP address of the database server host.
Enter the port for the DB2 database, default is 50000 – but this you need to change when you setup your DB2 server, to something else like 50500.
Enter the name of the database.
Enter the name of the user to access the database (can be DB2 default user db2inst1) and enter the password.
Scroll down and click on Test connection.
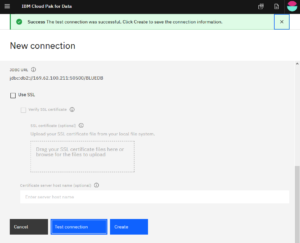
Click on Create.
You have now a data source in CP4D.
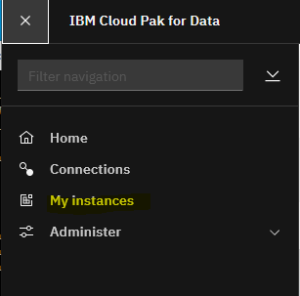
Click on menu and select My instances – to see what applications are running.
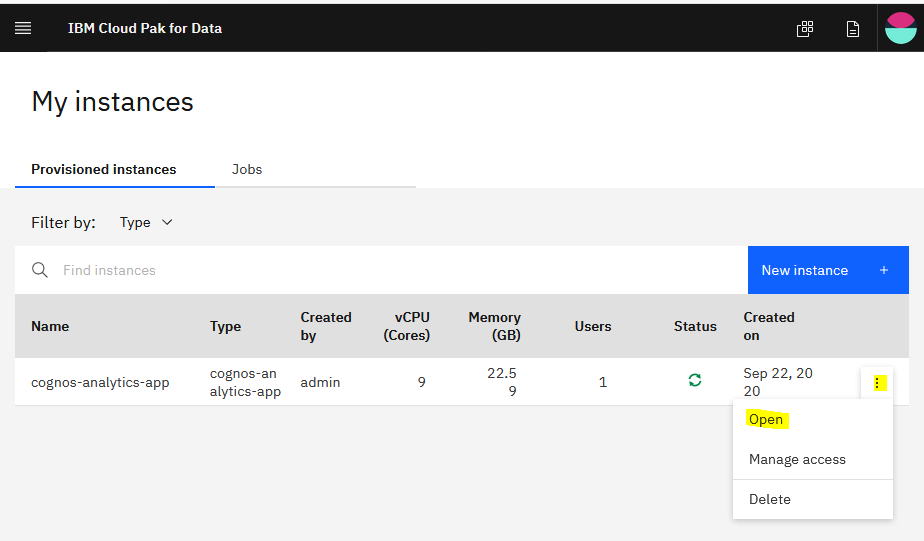
Click on the dots to open the menu on the right side of your application, and click on open to go to Cognos Analytics.
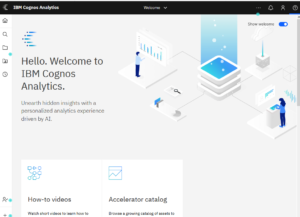
If security is setup correct, you should be logged in automatically.
To setup a data source for CA11, you can use the same as you done in CA11 on Windows. Described below;
Setup in Cognos Analytics 11
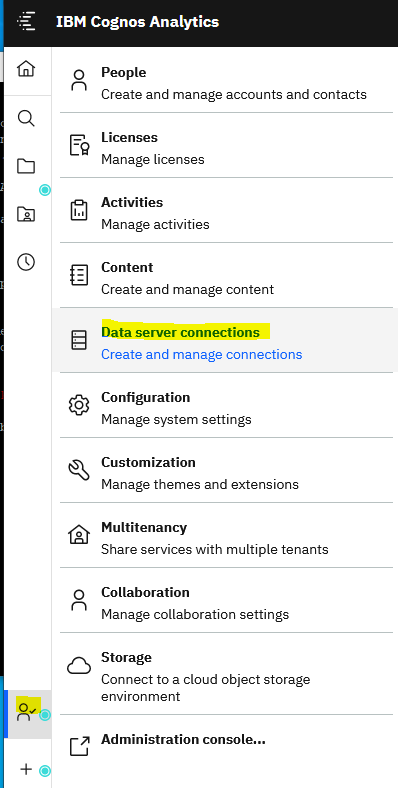
Click on Manage icon in lower left corner and select Data Server Connections
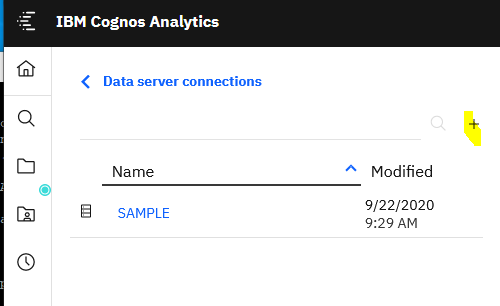
Click on + to create a new data connection, the dialog will expand to the right.
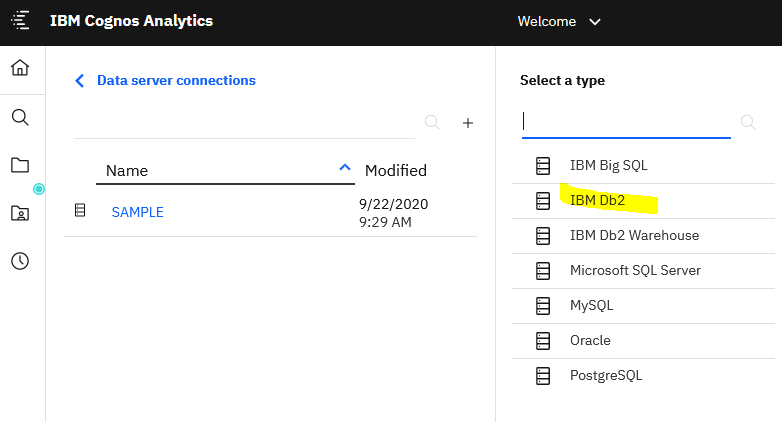
Select DB2 in this case
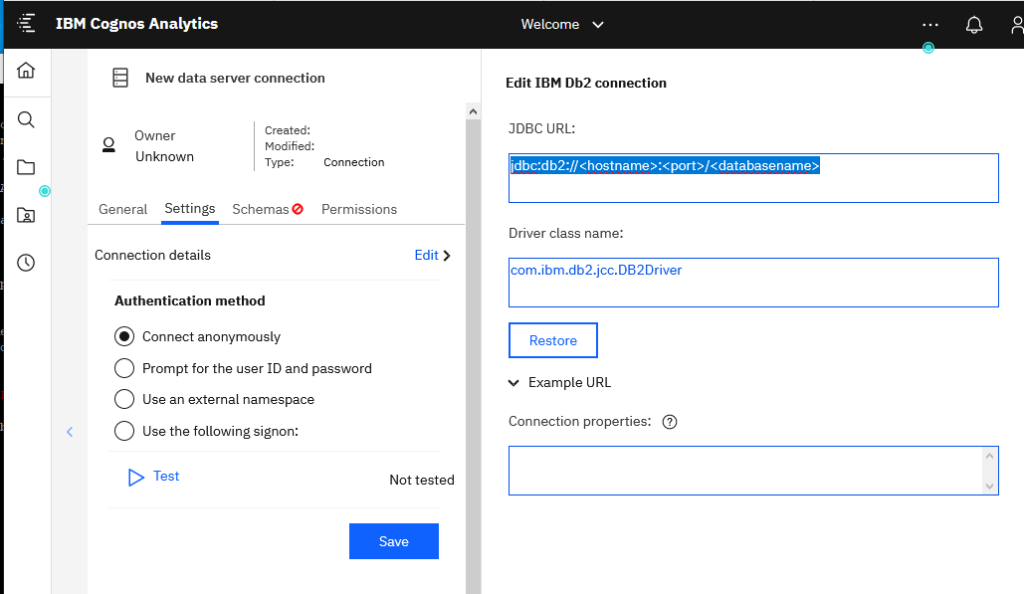
First enter the jdbc:db2://192.168.1.15:50500/SAMPLE2 to your database.
Scroll down and click close
Select Use the following signon
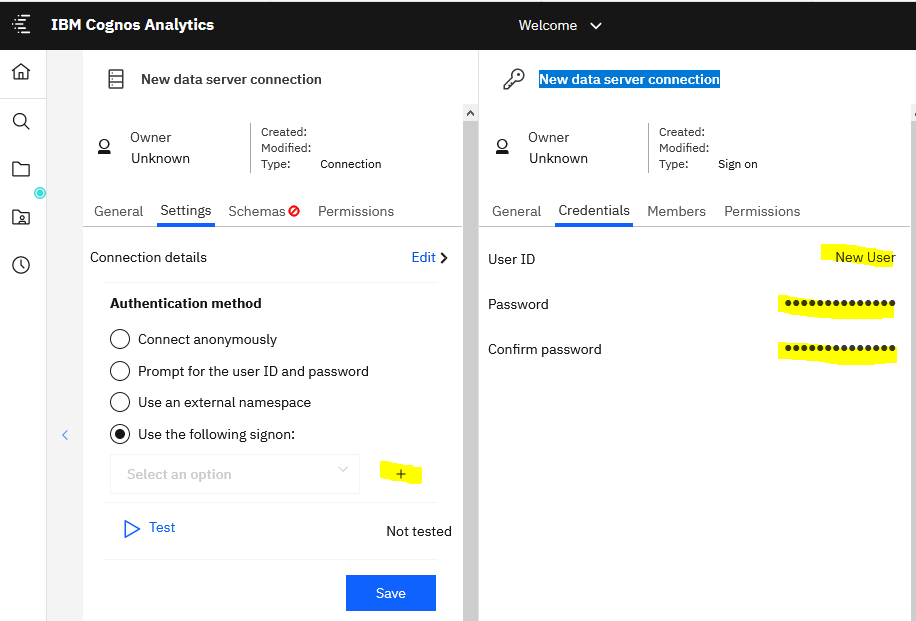
Click on ? to create a new signon, enter the user and password that will connect to the DB2 database.
Change the name for the connection to SAMPLE2.
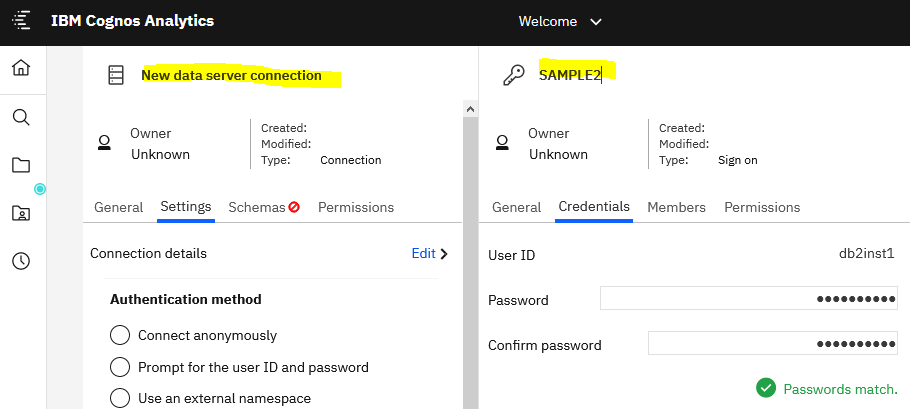
Change the name of the connection and click save.
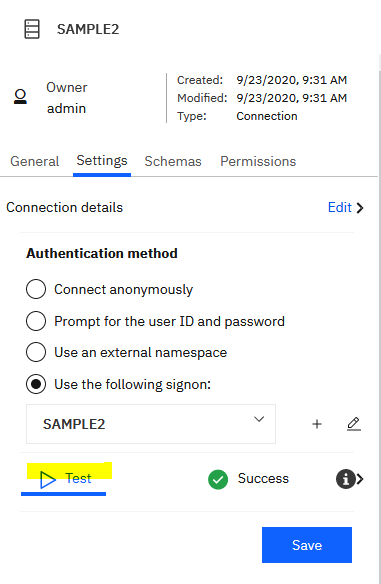
Click on Test and after success, click on schemas tab.
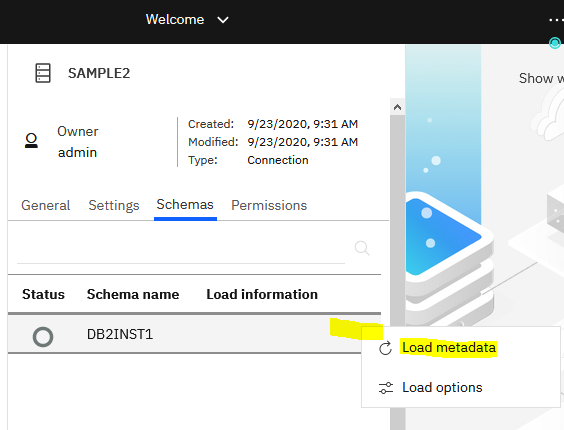
Click on dots to show the options, and click on Load metadata.
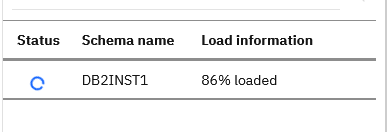
Wait for the metadata to load.
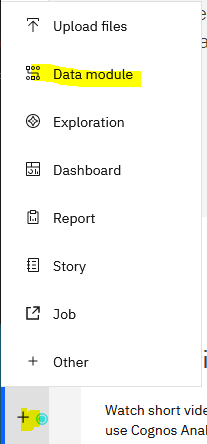
Click on new icon and select Data module.
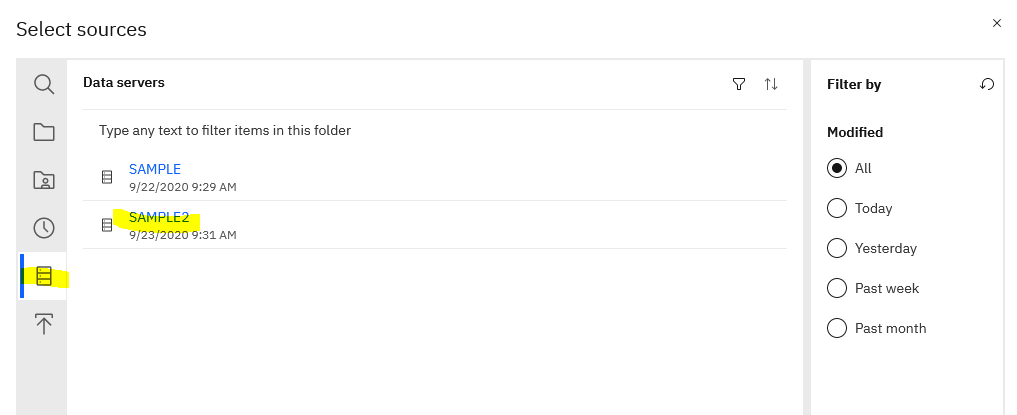
Click on the data icon and select your data source from the list. New dialog opens automatic.
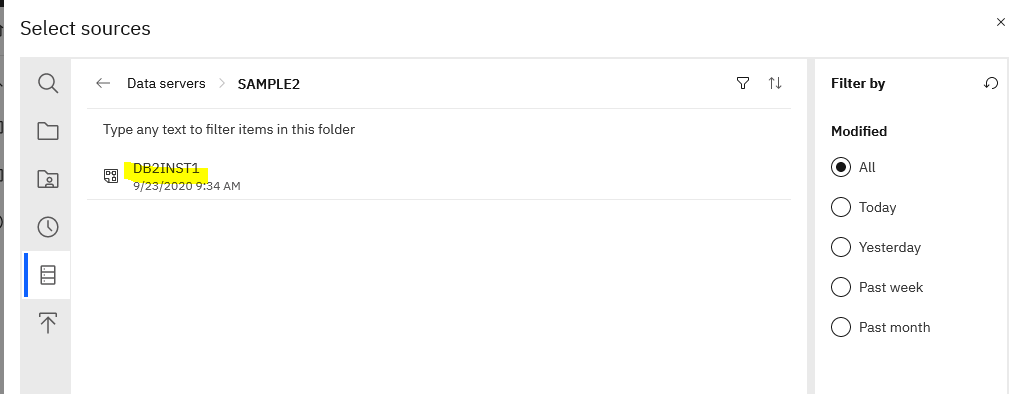
Click on the schema to work with and click OK.
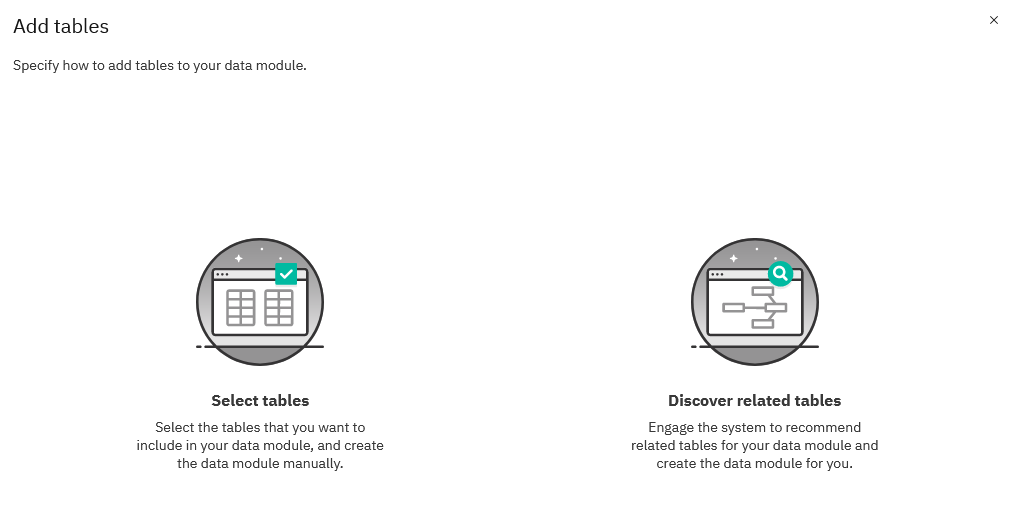
Click on Discover related tables and click Next
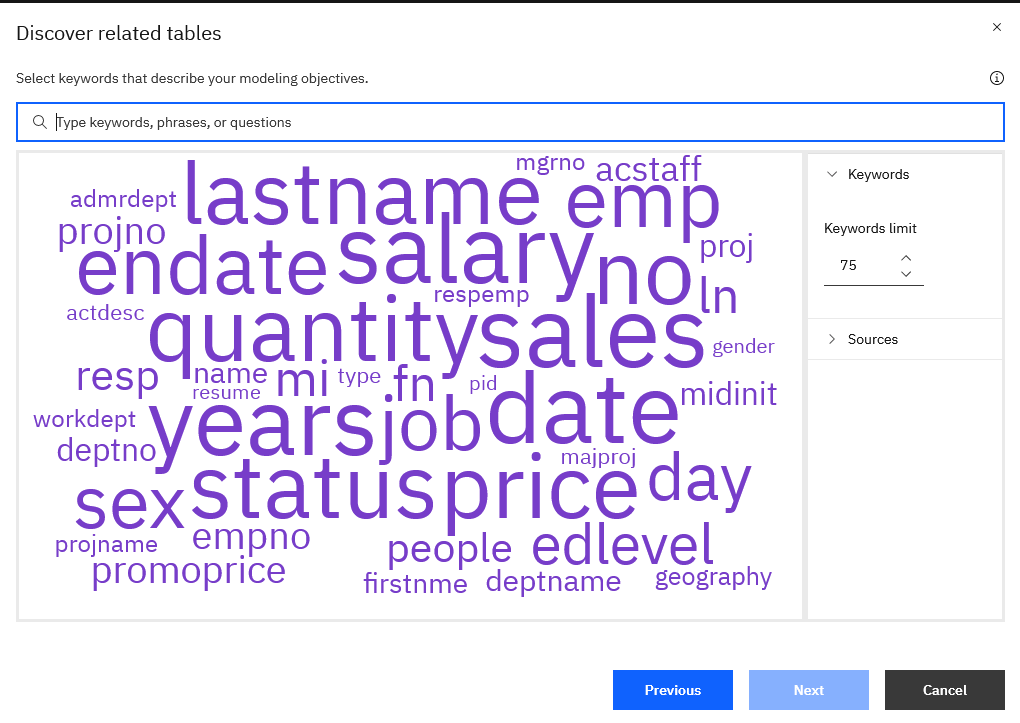
Cognos Analytics will show in word diagram the most popular fields. Select 3 of them and click next.
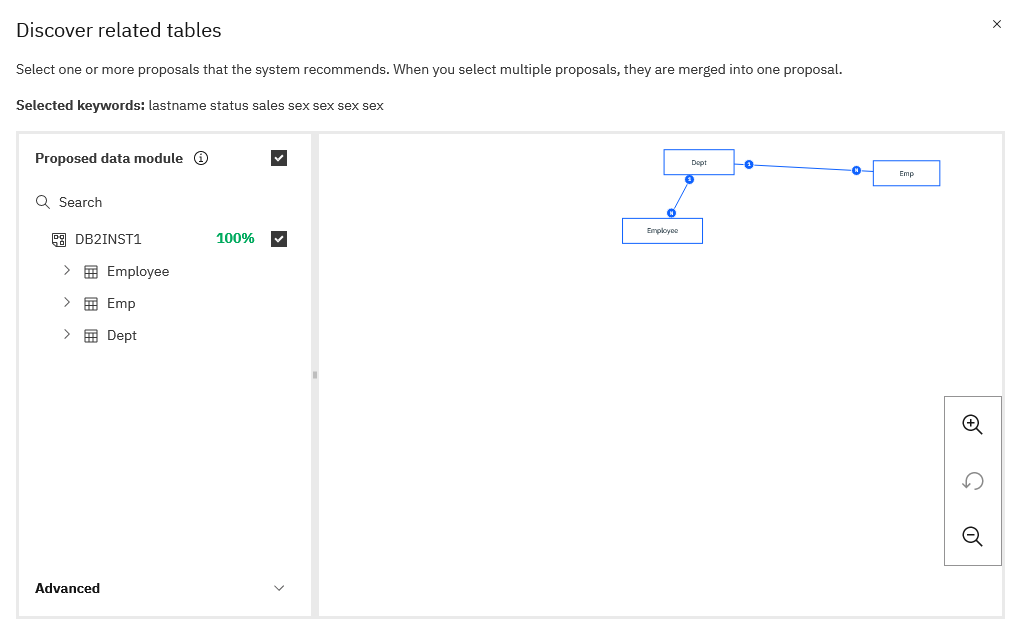
Table relations is shown, click OK.
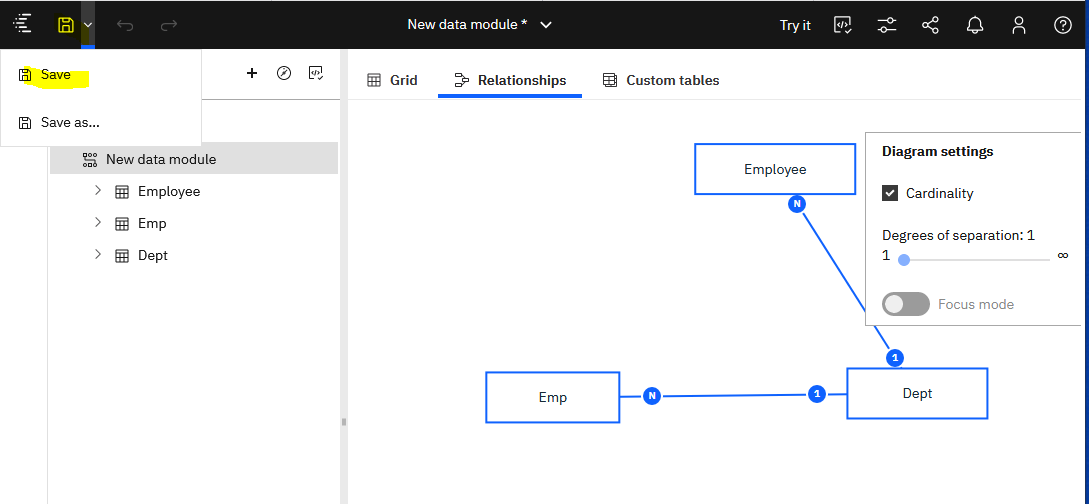
Click on save icon in top left corner.
Select to save as.
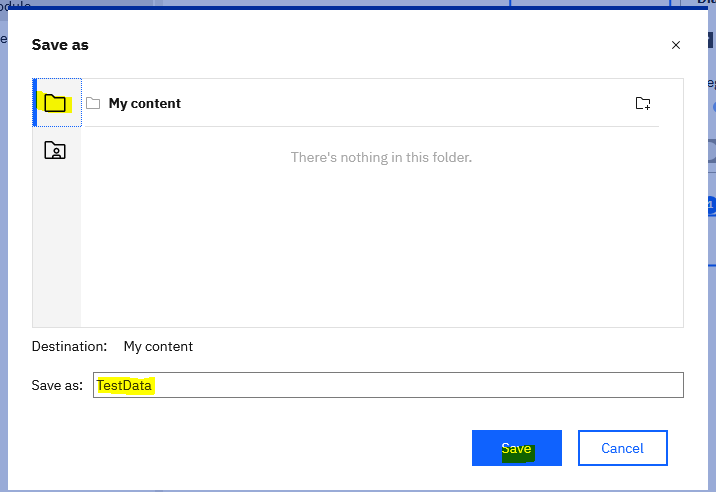
Click on my content or the folder where you want it to be saved.
Enter a name for the data module.
Click on save.
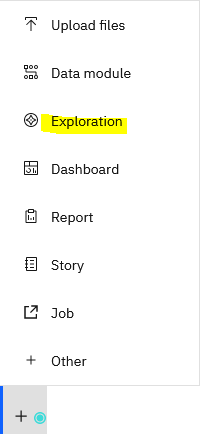
Click on new icon and exploration.
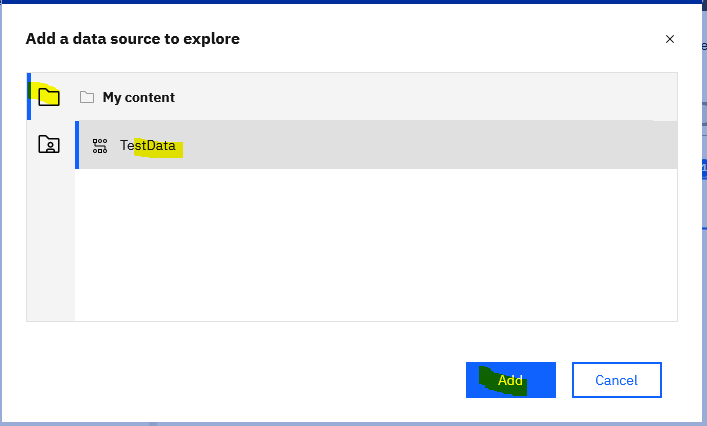
Select the folder, select the data module and click add.
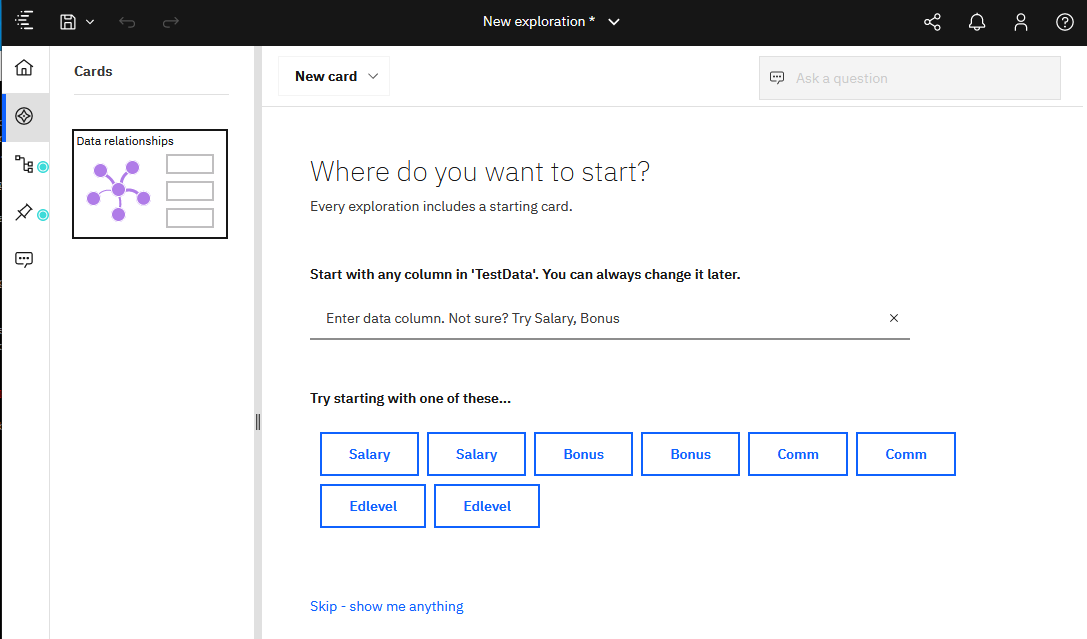
Enter a table name or click on the boxes to select the data you want to find out about.
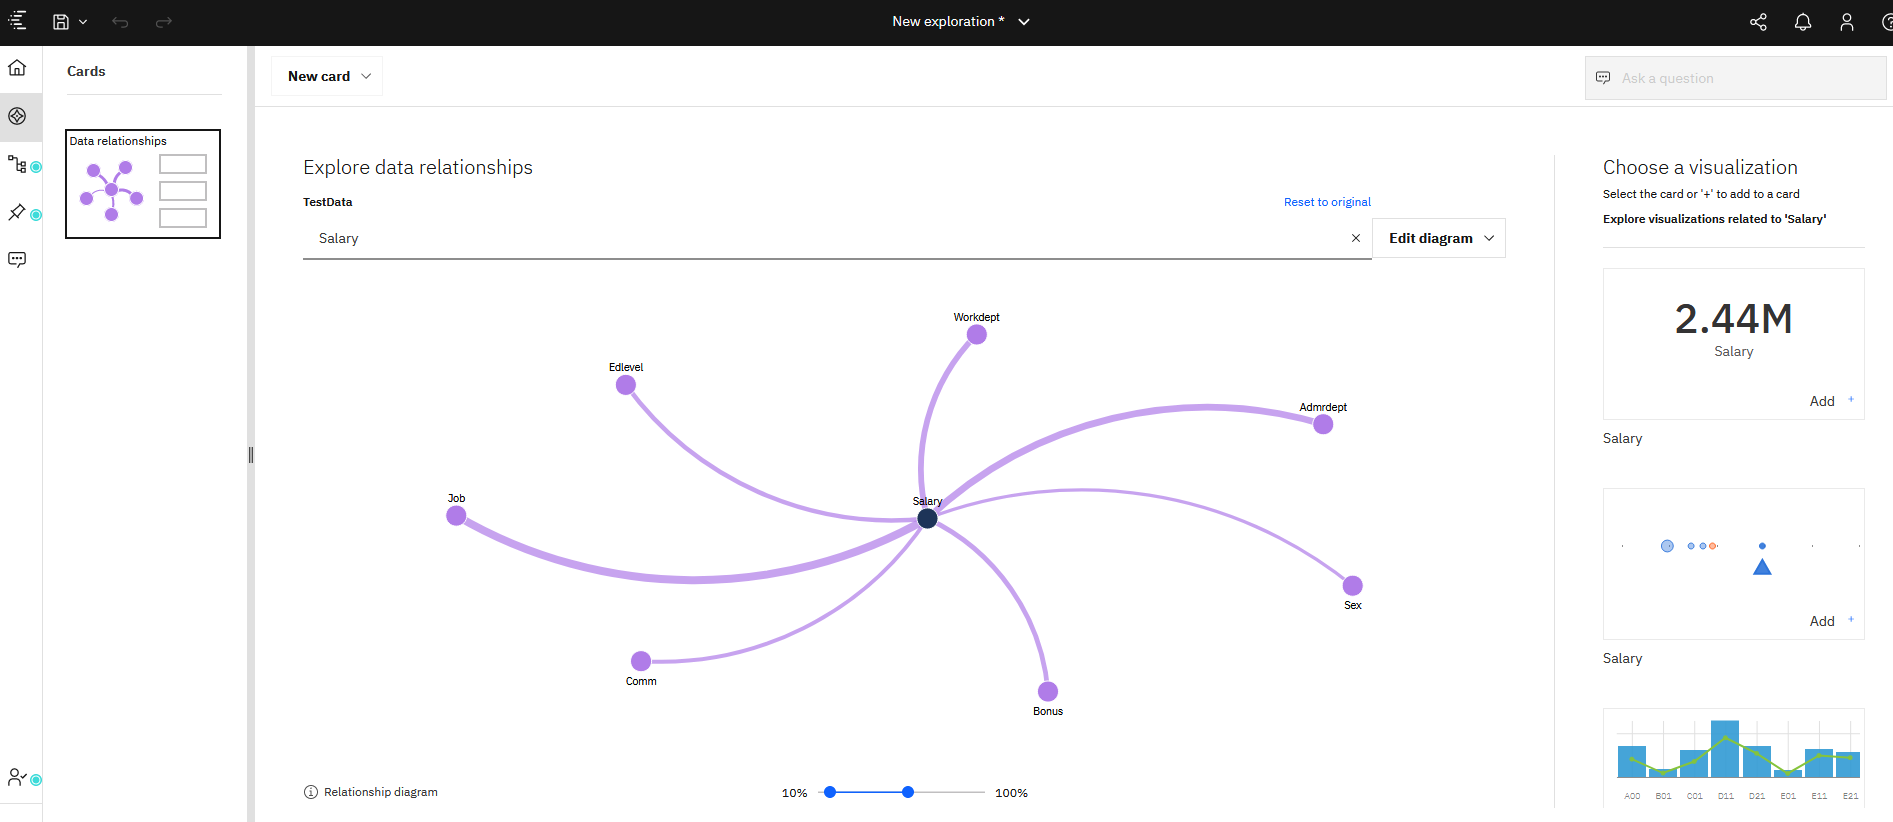
Select one of the charts on the right, if they fit your question.
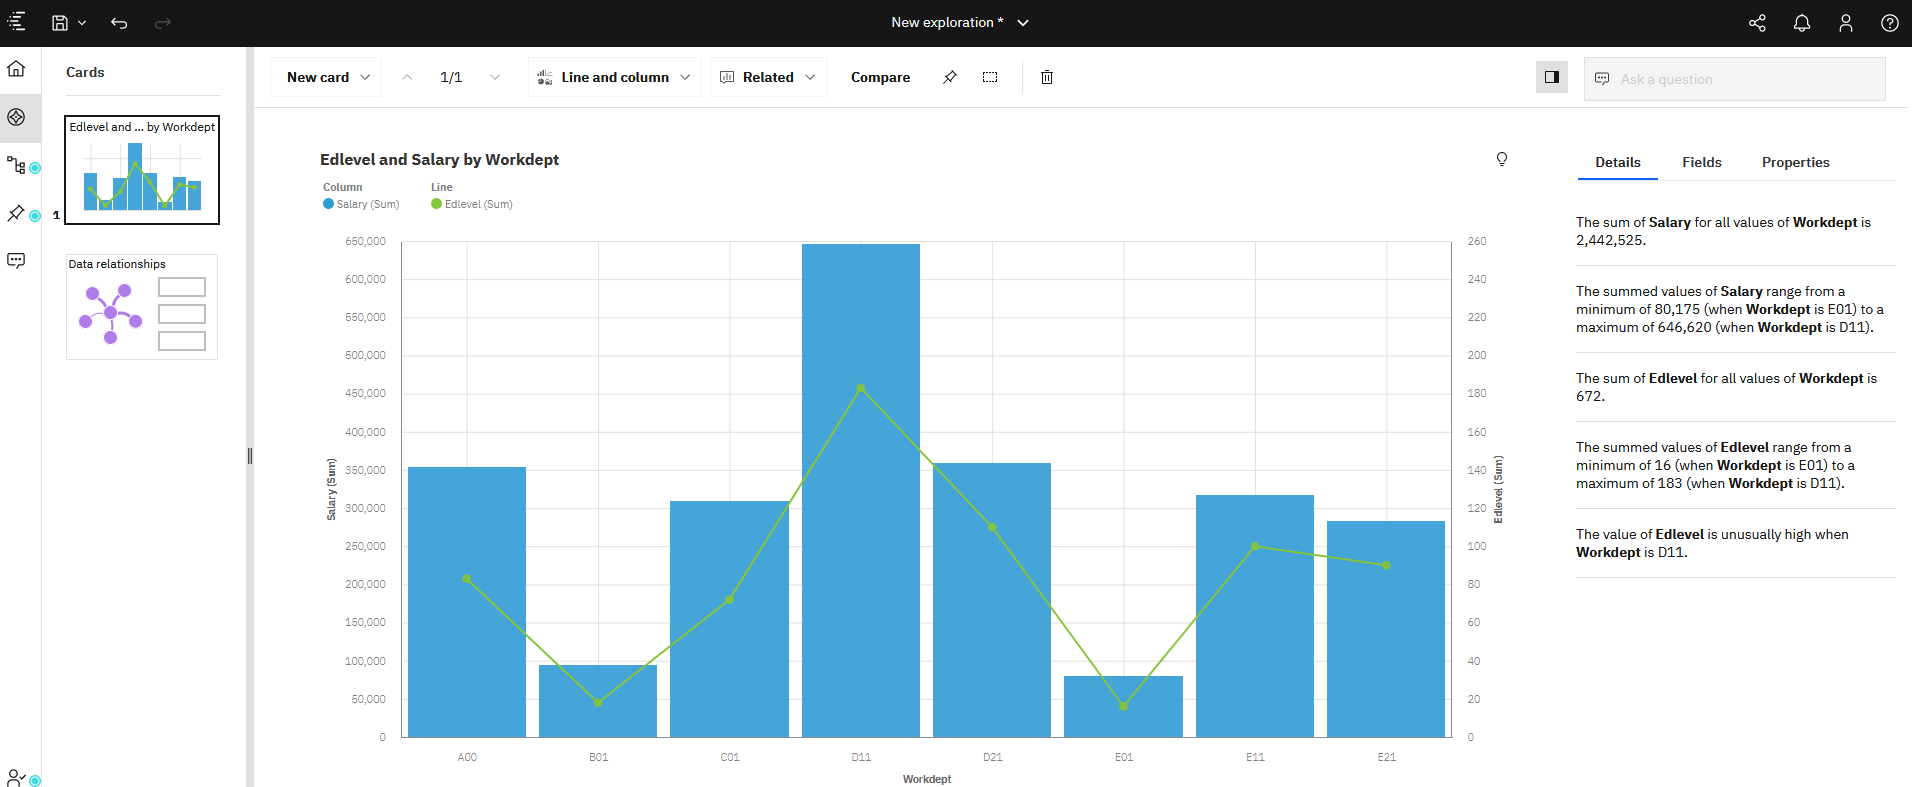
When you are satisfied with your chart, click save icon to store the report in the folders inside Cognos Analytics.
More information:
https://www.youtube.com/watch?v=XkOkje0tXgI
https://www.youtube.com/watch?v=0NtellENB88
https://www.youtube.com/channel/UCS3gkkTTvLOc9HTUJSNeOxg
https://www.ibm.com/cloud/garage/dte/tutorial/ibm-cognos-analytics-1113-getting-started-exploration-0/
https://www.ibm.com/support/producthub/icpdata/docs/content/SSQNUZ_current/wsj/manage-data/conn-cognos.html