Product:
Planning Analytics 2.0.9.19
Microsoft Windows 2019 server
Issue:
How use variables in data tab in ASCIIOUTPUT from string in prolog tab?
Solution:
Create the string with the variables with % around them.
In data tab use command EXPAND to convert the varibles to the correct value.
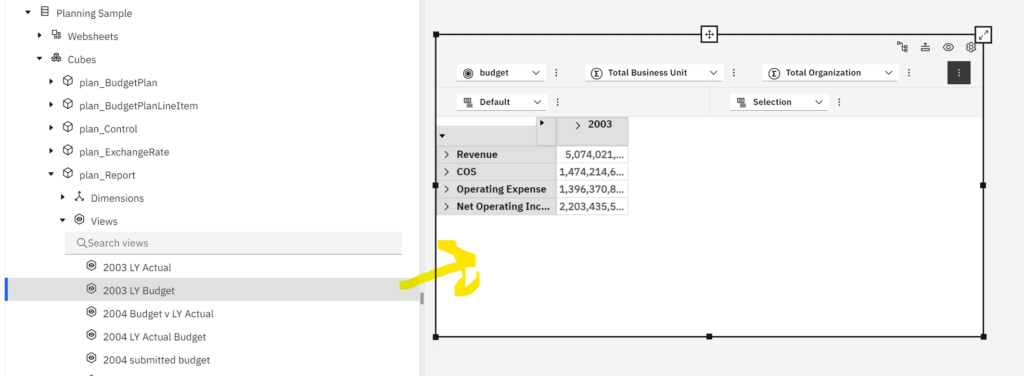
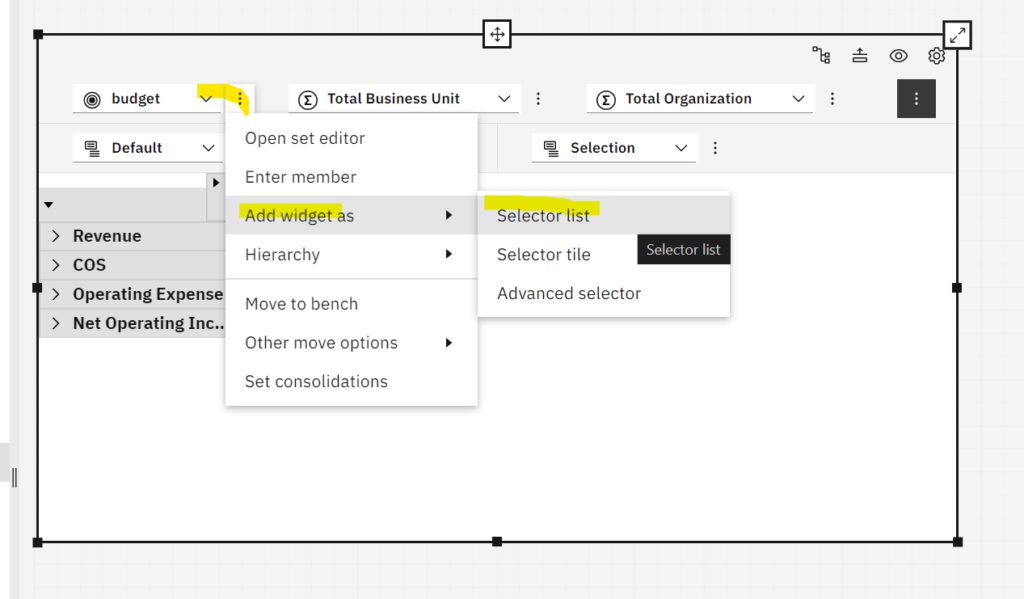
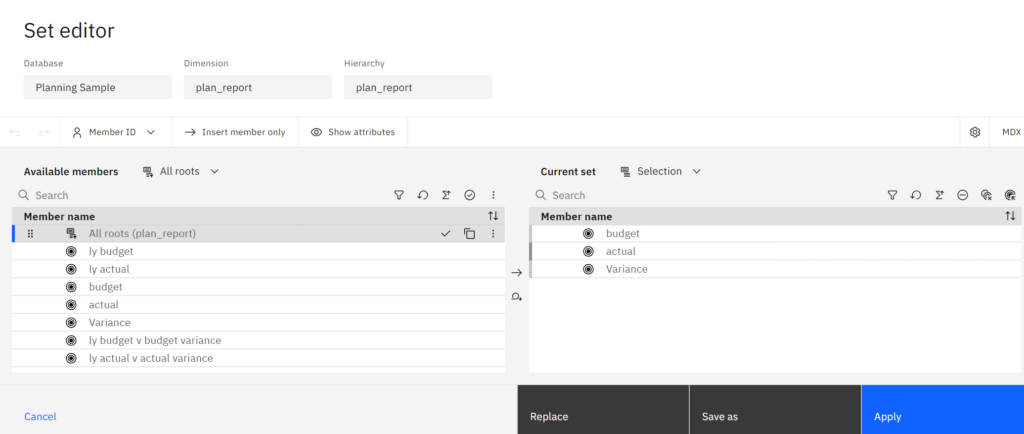
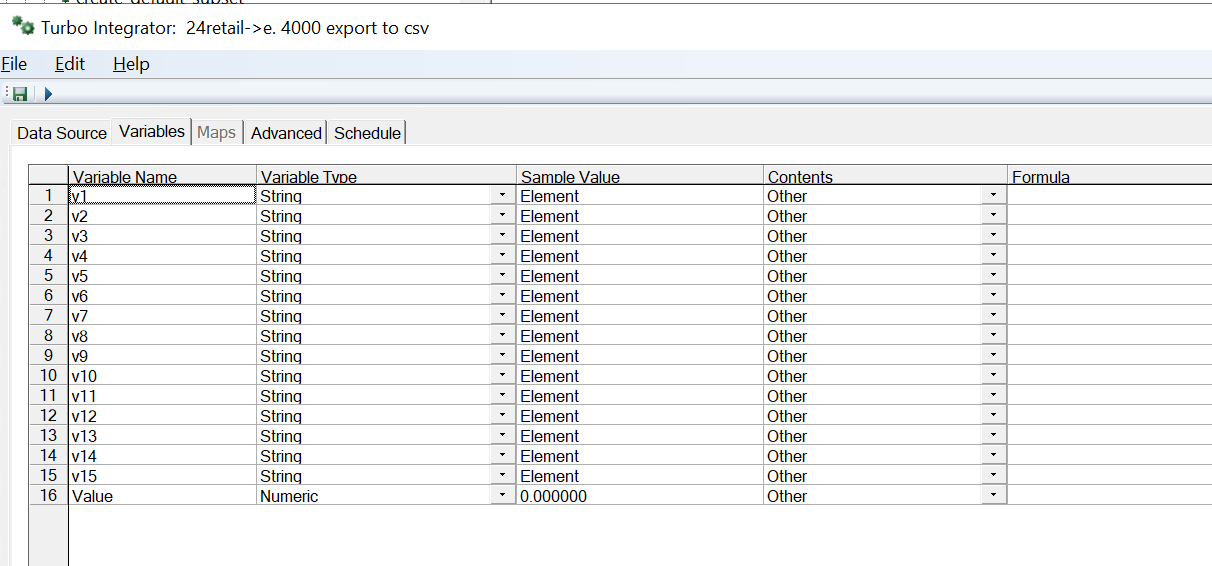
To export a cube content, build a view of the cube first, you then need to create the variables, good to name them like v1, v2 etc.
In prolog – build up your string like this:
# add above subset to the view
cCounter2 =1;
WHILE(cCounter2 <= nSteps);
sDimName = TABDIM(Cube, cCounter2) ;
ViewSubsetAssign ( Cube, ViewName, sDimName, SubName );
# build up the string to print out in data tab
IF (cCounter2 = 1) ;
stexttoexecute = ('%v' | numbertostring(cCounter2) | '%');
ELSE;
stexttoexecute = stexttoexecute | ',' | ('%v' | numbertostring(cCounter2) | '%' );
ENDIF;
cCounter2 = cCounter2 + 1;
END;
Then print it out in data like this
WHILE (cCounter3 > 0 ) ;
# write the header in the file
ASCIIOutput( vFilePath, sHeaderLine ) ;
cCounter3 = 0;
END ;

ASCIIOutput ( vFilePath, EXPAND (stexttoexecute) , NumberToString( NValue ) ) ;
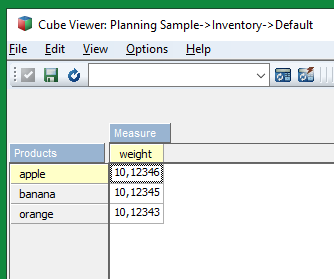
In this example we export the data from the revenue cube in sample 24retail database.
Create a dummy cube with 15 dimensions, that you have as datasource.
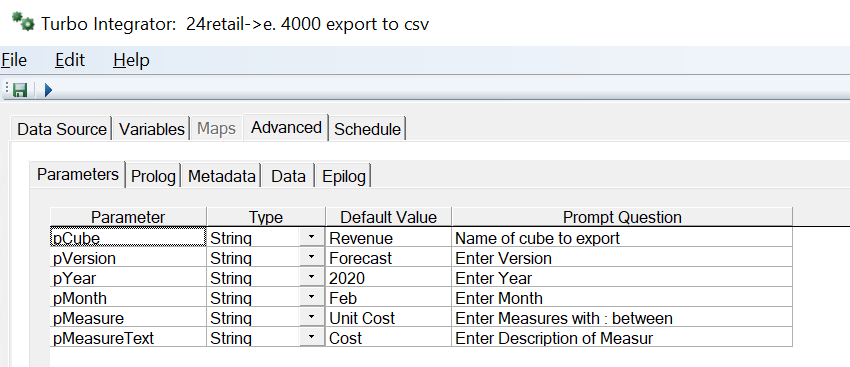
Create prompts that give you what data to export, you need to enter the correct element names and measures.
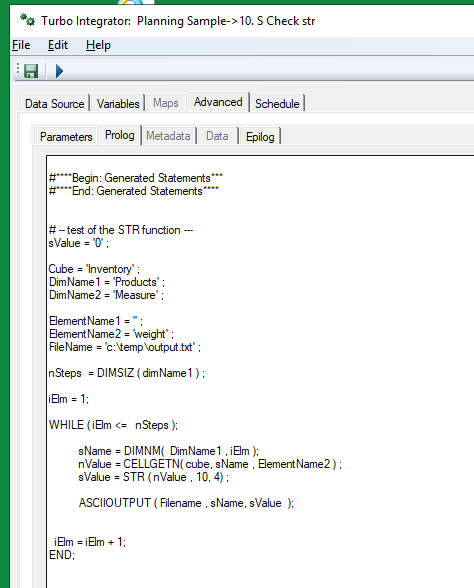
Enter below code in PROLOG:
#****Begin: Generated Statements***
#****End: Generated Statements****

# set variabler
Cube = pCube;

sName = GetProcessName();
ViewName = sName ;
SubName = sName ;

sHeaderLine = '';
cCounter1 = 1;
cCounter2 = 1;
cCounter3 = 1;

# erase view from before
ViewDestroy ( Cube, ViewName );

# create the path - you can get the values from a cube or made the filename up from the prompts
sPath = 'D:\temp\';
# create file name
vFile = 'Aexportdatafromcube.csv';
vFilePath = sPath | vFile;

# check number of dimensions
nSteps = CubeDimensionCountGet (cube) ;

# destroy the view first
ViewDestroy ( Cube, ViewName );
# erase all subset to the view
cCounter2 =1;
WHILE (cCounter2 <= nSteps);
sDimName = TABDIM(Cube, cCounter2) ;
SubsetDestroy ( sDimName, SubName );
cCounter2 = cCounter2 + 1;
END;


# Create the new view and subset of selected data
ViewCreate ( Cube, ViewName );

WHILE(cCounter1 < nSteps);
# get the dimension name
sDimName = TABDIM(Cube, cCounter1) ;
IF ( sDimName @= 'Year' );
SubsetCreate ( sDimName, SubName );
SubsetElementInsert ( sDimName, SubName, pYear, 1 );
ELSEIF ( sDimName @= 'Month' );
IF (pMonth @= 'AllMonths');
SubsetCreateByMDX ( SubName, '{TM1FILTERBYLEVEL( {TM1SUBSETALL( [' | sDimName | '] )}, 0)}' );
ELSE;
SubsetCreate ( sDimName, SubName );
SubsetElementInsert ( sDimName, SubName, pMonth, 1 );
ENDIF;

ELSEIF ( sDimName @= 'Version' );
SubsetCreate ( sDimName, SubName );
SubsetElementInsert ( sDimName, SubName, pVersion, 1 );
ELSE;
SubsetCreateByMDX ( SubName, '{TM1FILTERBYLEVEL( {TM1SUBSETALL( [' | sDimName | '] )}, 0)}' );
ENDIF;
# create the header line to the file with dim names
IF (cCounter1 = 1);
sHeaderLine = sDimName;
ELSE;
sHeaderLine = sHeaderLine | ',' | sDimName ;
ENDIF;

cCounter1 = cCounter1 + 1;
END;

# add the measures to the last dimension
IF ( cCounter1 = nSteps) ;
sDimName = TABDIM(Cube, cCounter1) ;
SubsetCreate ( sDimName, SubName );
sHeaderLine = sHeaderLine | ',' | sDimName ;

# find the measure in last parameter
pMeasurePart = pMeasure ;
vScan_1 = SCAN ( ':' , pMeasurePart);
sMeasure = pMeasure ;
IF (vScan_1 = 0) ;
sMeasure = pMeasurePart ;
SubsetElementInsert ( sDimName, SubName, sMeasure, 1 );
ELSE;

WHILE ( vScan_1 > 0 );
# find the next colon
vScan_1 = SCAN ( ':' , pMeasurePart);
IF (vScan_1 = 0) ;
sMeasure = pMeasurePart ;
ELSE ;
sMeasure = SUBST ( pMeasurePart, 1, vScan_1-1 );
# truncate the text to be only part after the colon
pMeasurePart= SUBST ( pMeasurePart, vScan_1+1, LONG (pMeasurePart ) - vScan_1);
ENDIF ;


# extra check if value is blank - do not insert the sMeasure
IF ( sMeasure @<> '' );
SubsetElementInsert ( sDimName, SubName, sMeasure, 1 );
ENDIF;
END;
ENDIF;
ENDIF;

# add the last column value
sHeaderLine = sHeaderLine | ',' | pMeasureText ;

# add above subset to the view
cCounter2 =1;
WHILE(cCounter2 <= nSteps);
sDimName = TABDIM(Cube, cCounter2) ;
ViewSubsetAssign ( Cube, ViewName, sDimName, SubName );
# build up the string to print out in data tab
IF (cCounter2 = 1) ;
stexttoexecute = ('%v' | numbertostring(cCounter2) | '%');
ELSE;
stexttoexecute = stexttoexecute | ',' | ('%v' | numbertostring(cCounter2) | '%' );
ENDIF;
cCounter2 = cCounter2 + 1;
END;

###  set what to exclude from the view
ViewExtractSkipCalcsSet ( Cube, ViewName, 1);
ViewExtractSkipRuleValuesSet ( Cube, ViewName, 0 );
ViewExtractSkipZeroesSet ( Cube, ViewName, 1 );


# Set source
DataSourceType='VIEW';
DataSourceNameForServer=Cube;
DataSourceCubeview=ViewName;

# Change to get comma in the text file
DatasourceASCIIQuoteCharacter='';
DatasourceASCIIDelimiter = ',';
Enter below code in DATA:
WHILE (cCounter3 > 0 ) ;
# write the header in the file
ASCIIOutput( vFilePath, sHeaderLine ) ;
cCounter3 = 0;
END ;

# print out the values from the cube - check if text or number on value
IF (Value_Is_String = 0);
ASCIIOutput ( vFilePath, EXPAND (stexttoexecute) , NumberToString( NValue ) ) ;
ELSE;
ASCIIOutput ( vFilePath, EXPAND (stexttoexecute) , ( SValue ) ) ;
ENDIF;
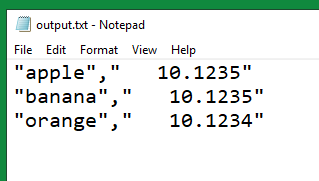
Should give you a csv file in d:\temp folder.
More Information:
https://community.ibm.com/community/user/businessanalytics/blogs/declan-rodger/2021/09/10/time-to-stop-using-expand
The Expand Function in TI processes is used to convert Variable names enclosed in % symbols to the contents of the variable at run time.
Below code (on my metadata or data tabs) to export the Country variable for the data record that is being processed:
TextOutput ( cFileName, Expand ( %vsCountry% ) );
The Expand function also converts its entire contents into 1 concatenated string, the 2 examples below would do the same thing:
TextOutput ( cFileName, vsCountry, vsStore, vsProduct, NumberToString ( vnVolume), NumberToString ( vnRevenue), NumberToString ( vnCost ), NumberToString ( vnProfit ) );
TextOutput ( cFileName, Expand ( %vsCountry%, %vsStore%, %vsProduct%, %vnVolume%, %vnRevenue%, %vnCost%, %vnProfit% ) );
https://www.ibm.com/docs/en/planning-analytics/2.0.0?topic=functions-expand
https://www.wimgielis.com/tm1_reworkingexcellayoutII_EN.htm
https://quebit.com/askquebit/debugging-a-turbointegrator-process/